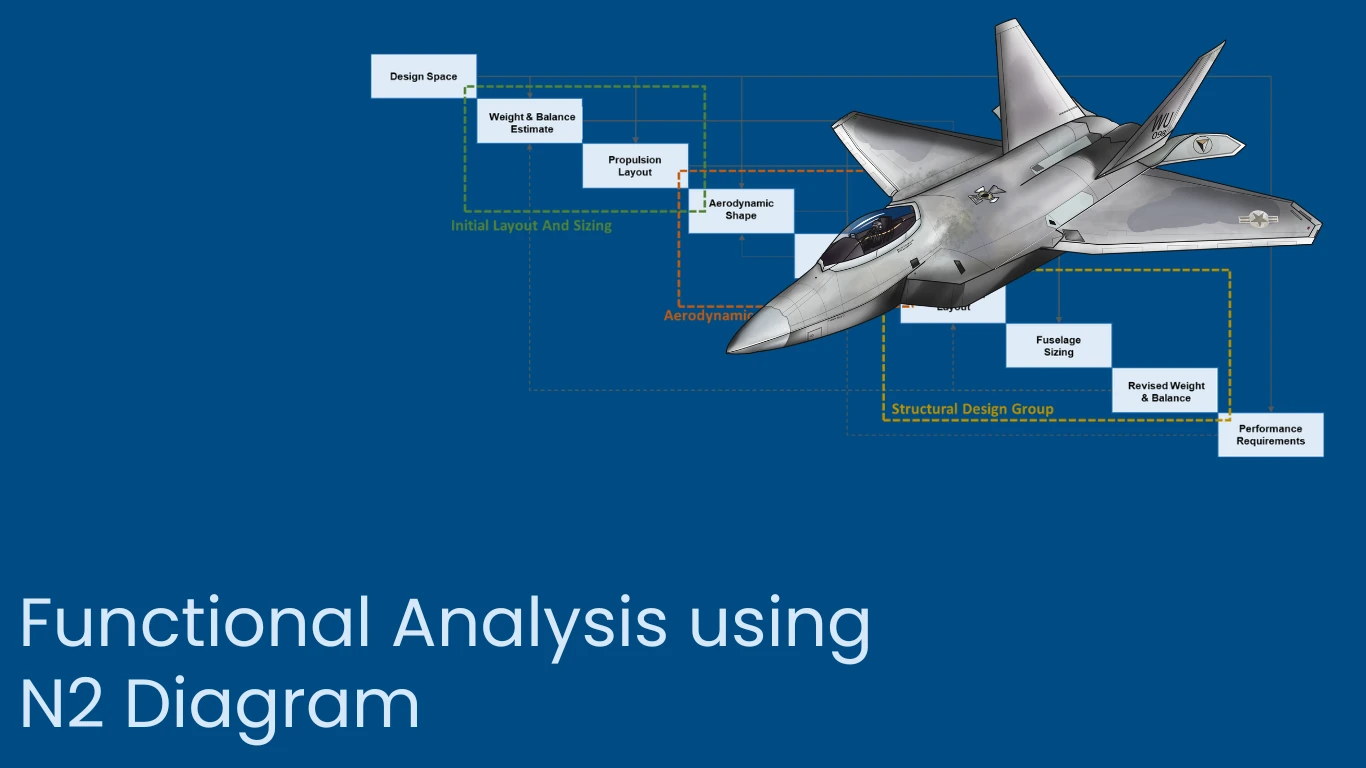
Functional analysis is one of the essential processes in systems engineering, where functions that each subsystem has to perform are derived based on the needs and objectives. The N2 diagram is a simple and efficient way to sort out the interface dependency among various functions of a system and has vast application in aerospace engineering.

The N2 diagram is initially developed to be a tool of interface control and to manage flow of information. However, it has become a mathematically consistent solution to the functional analysis.
What is an N2 Diagram?
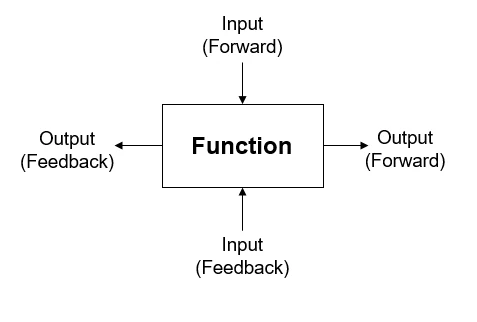
The diagram depicts the interactions between functions of a system model by interfacing the flow of information. “N2” is a matrix format for N×N systems, with system functions mapped from top left to bottom right along the diagonal.
The inputs and triggers for each function are mapped in its column, and the outputs are mapped in its row. That means input/information to a function coming from predecessor functions is in the same column above the subject function, and inputs from subsequent functions are in the same column below the subject function. Similarly, output from a function flows row-wise, to the right towards the incoming functions and toward left towards the previous functions.

Key Takeaways
- N2 Diagram: describes the logical data exchanges between functions in a system
- It assist in recognizing inputs, outputs and triggers for every function
- It enables system partitioning by grouping a related set of functions together
- These diagrams help to manage the interfaces by tracking data flows

Eelements of an N2 diagram
- Subsystem Boundary: High interdependent and tightly bound elements in form of forward and feedback loops indicate complex interaction
- Critical Function: A single element that takes input from multiple elements and potentially an interlink between the two subsystem
- Sequential Relation: Typical linear relationship between the multiple elements with first-order dependency
- Missing Interface: A lack of feedback between the two elements, which have otherwise tightly coupled elements all across, indicating lack of feedback
N2 Analysis in Systems Engineering
N2 diagrams help illustrate the data interactions between functions to aid in analytics objectives like:
- Managing system interfaces
- Partitioning system behavior
- Assigning functions to components
- Continuity of data flows
- As such, they are an indispensable building block for architects and analysts studying the operational architecture of a system.
Role of N2 Diagrams in Functional Analysis
The N2 diagrams are used to uniquely support functional analysis activities in a few key ways:
Visual Representation of Logical Data Processing
In an N2 matrix layout, attention is paid to the data flows that exist between the functions. These connections are labeled as inputs, outputs, and triggers.
This data flow is expressed logically, shedding light on interface relationships that might remain obscured in a traditional structural decomposition or activity sequencing view.
Critical and Feedback Loop
A function can be identified as a critical function if it provides output to many functions. Such processes will be critical to the system’s performance. If the input of many predecessor functions is linked to a critical function, then the system performance may be optimized through an iterative process.
Nodal Points and Partitioning
In N2 diagrams, clusters of tightly coupled functions become clearly visible. This helps guide partitioning decisions by indicating where subsystem boundaries may occur. Highly dense interface regions also inform function-to-component allocation decisions. A nodal point may identify such a boundary by indicating only a single feedforward flow of information at a function.
Application of N2 Diagram in Aerospace
The N2 diagram is a comprehensive visualization method that illustrates the interconnections between various system components, facilitating better understanding and management of complex aerospace systems. There are many applications of it, i.e., aircraft design and avionics architecture.
Aircraft Design Optimization
Aircraft design is an iterative process, and decisions made in the early design phase have an everlasting effect. The N2 diagram is a vital tool in multidisciplinary design optimization (MDO), particularly in the optimization of air-vehicle design. In MDO, the N2 diagram helps identify relationships among disciplines, such as aerodynamics, structures, and propulsion.

System Architecture
The N2 diagram complements other modeling tools, such as the Design Structure Matrix (DSM), by providing a more detailed representation of system architecture. This enhances collaboration among multidisciplinary teams, enabling them to address design challenges effectively. Overall, the N2 diagram is indispensable for managing complexity and fostering innovation in aerospace design optimization efforts.
Identification of Subsystems and Assemblies
Organizing components along the main diagonal and displaying interactions in off-diagonal cells allows systems engineers to visualize data flow and dependencies. The functional flow of activities and tasks can identify the highly interdependent and feedback loop elements. These elements can be combined into a single subsystem or assembly to reduce the system complexity. This clarity aids in diagnosing issues and optimizing design processes by highlighting critical elements that may affect overall system performance. For instance, a failure in one component can be traced through the N2 diagram to assess its impact on other components and subsystems.
Role of N2 Diagrams in Interface Control
Interface control is a crucial responsibility of a systems engineer, and the N2 diagram is a great way to manage the interface control. For example, if some pair of elements in the functions have no interfaces identified in the N2 diagram, such pairs may represent a gap that needs to be addressed in any subsequent functional architecture.
Missing Inputs or Outputs
The empty cells within a row or column for a function may signify an input or output that needs to be specified in order to fully define information flows.
Defining Needed Interfaces
Functions that do not take any input, return anything out, or are cut off from the rest of the system may identify a problem in the system architect.
Checking Data Flow Continuity
Pathing columns and rows to verify starting and ending points confirm that data reaches its full flow — from source values up until final sink values
Focusing on the Interface Density
A simple cell color code indicating interaction density allows for rapid visualization of the connectivity between different functions. Naturally, boundaries of partitions of subsystems represent the majority of dense connectivity.
Minimal Interface
High cohesion translates into little or no external interfaces; if such partitions can be defined as a subsystem (as explained earlier), then it will reduce the interface control management at system-level.
Conclusion
N2 diagrams offer a unique perspective on system architecture that is incredibly useful for functional analysis such as systems partitioning, allocation, and interface management. Matrix format for logical data flows brings into focus the data dimension of system behavior and is, therefore, complementary to control-centric views. N2 diagrams can also be applied to mapping other perspectives of architectural and organizational relationships based on the ability of people to adapt.

